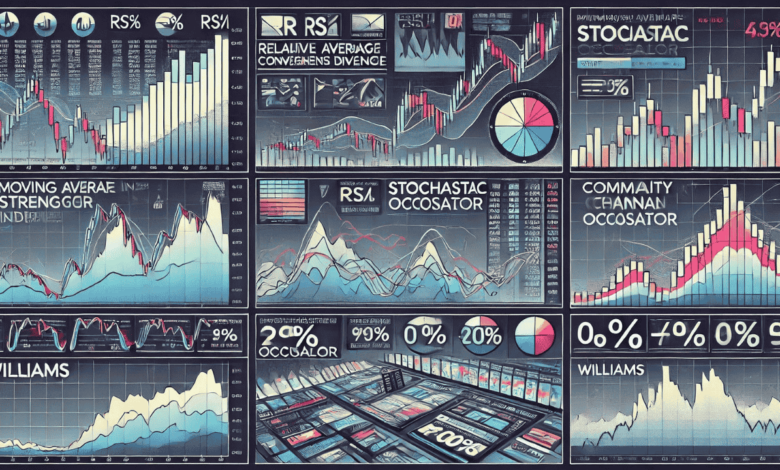
Understanding Different Oscillators

Oscillators are technical analysis tools used by traders. These tools are used to understand market momentum, overbought or oversold stock conditions, and any trend reversals. In this article, we will help you understand what oscillators are, how they work, and talk about some of the common oscillators. So, let’s start!
What are Oscillators?
Oscillators are tools that traders use to track the movement of stock prices within a certain range, usually between 0 and 100. They work by comparing the current price of an asset to its past performance.
When the oscillator is at the higher end of the scale, it might be a sign that the asset has been overbought, which could lead to a sell-off. On the flip side, if it’s near the lower end, it could indicate that the asset is oversold, suggesting that it might be a good time to buy.
These indicators are useful in markets where prices aren’t trending strongly in one direction. They offer insights that help traders make informed decisions about when to jump in or out of a trade. But you should keep in mind that oscillators tend to be more reliable when they’re used alongside other indicators. You should learn technical trading to understand this better.
Common Types of Oscillators
In this section, let’s take a look at a few commonly used oscillators:
Relative Strength Index (RSI)
The RSI is one of the most popular oscillators used by traders. It is a great tool for measuring the speed and change of price movements.
An RSI above 70 suggests an overbought stock condition. Conversely, an RSI below 30 indicates an oversold stock condition.
For example, if the RSI of a stock hits 75, it might be time for you to consider selling, as the stock could be overvalued.
Moving Average Convergence Divergence (MACD)
The MACD oscillator makes for an effective tool for helping traders understand the relationship between two moving averages of the price of a stock. This tool is good at identifying changes in the strength, direction, momentum, and duration of a trend.
When MACD crosses above its signal line, it means there is a bullish signal. On the other hand, a bearish signal takes place when MACD goes below its signal line.
Stochastic Oscillator
The Stochastic Oscillator compares a specific closing price of a stock to its price range over a particular period. Traders use this tool to understand overbought and oversold stock conditions.
Similar to the RSI, a reading above 80 suggests that the asset is overbought, while a reading below 20 suggests it is oversold. This tool is usually used by traders who focus on short-term trading strategies.
Commodity Channel Index (CCI)
The CCI is used to measure the difference between the current price of an asset and its average price over a certain period. When the CCI is high, it suggests the asset is trading well above its average, which could signal an overbought condition.
On the other hand, a low CCI tells us that the asset is trading below its average, possibly pointing to an oversold condition. This tool helps identify cyclical trends in commodities, but it can be used for other assets as well.
Williams %R
Williams %R is similar to the Stochastic Oscillator but operates on a scale of 0 to -100. This oscillator also helps understand overbought and oversold stock levels, with readings above -20 indicating overbought conditions and readings below -80 suggesting oversold conditions.
Williams %R works effectively in markets that are trending within a range and can help traders make more accurate entry and exit decisions.
If you want to learn more about oscillators, you can count on Upsurge.club for the best technical analysis course.
Conclusion
Oscillators can be incredibly useful for traders, offering key insights into market conditions that can help you decide when to buy or sell. However, it’s important to remember that they work more accurately when combined with other indicators and when you have a good understanding of the overall market.
Before diving into using oscillators in your trading, it’s a good idea to test them out in a demo account. This way, you can get a feel for how they work in real time without putting your money on the line.
You May Also Read: Debunking the Growth of ICICI Pru Mutual Fund AMC


